Creating Salesforce Debug Logs
What are Salesforce Debug Logs?
Creating Salesforce debug logs involves managing the tracking of events (transactions) occurring within the Salesforce organization. They encompass details about all ongoing transactions within Salesforce, including timestamps, transaction status, and other relevant information.
Salesforce debug logs are generated when a user activates a Trace Flag. These flags act as filters for the transaction logs, specifying the debug level, start and end times, log type (such as ERROR, WARN, DEBUG), and transaction status. Once a Trace Flag is set, the system generates debug logs whenever a user initiates a transaction. These logs serve as valuable resources for developers and integration partners alike.

Generate Salesforce Debug Logs
Salesforce boasts an intuitive user interface that facilitates a range of operations, including the creation of Salesforce Debug Logs directly from the interface. Follow the step-by-step process outlined below to generate Salesforce Debug Logs:
- Within the Salesforce window, locate the search box and enter ‘Debug Logs’. Select Debug Logs from the search results.
- To establish a Debug Log, click on ‘New’.
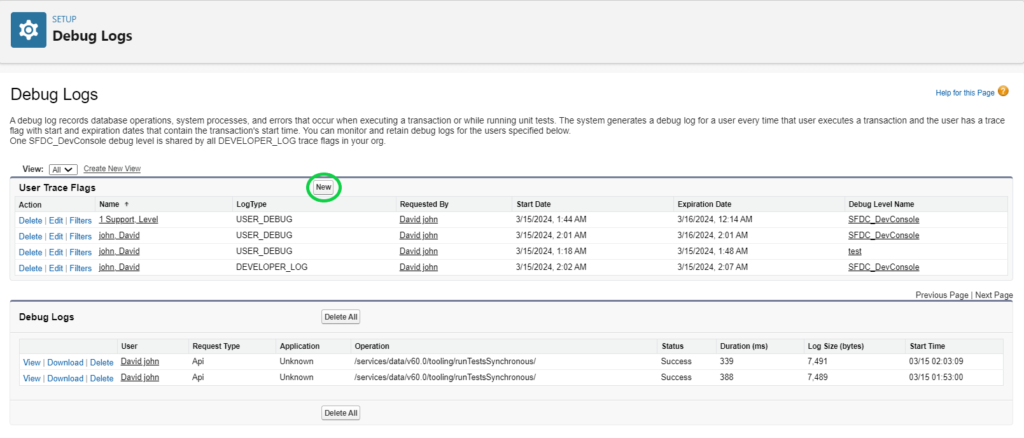
- Choose the user, start date, and expiration date (a future date) to configure the Debug Log settings.
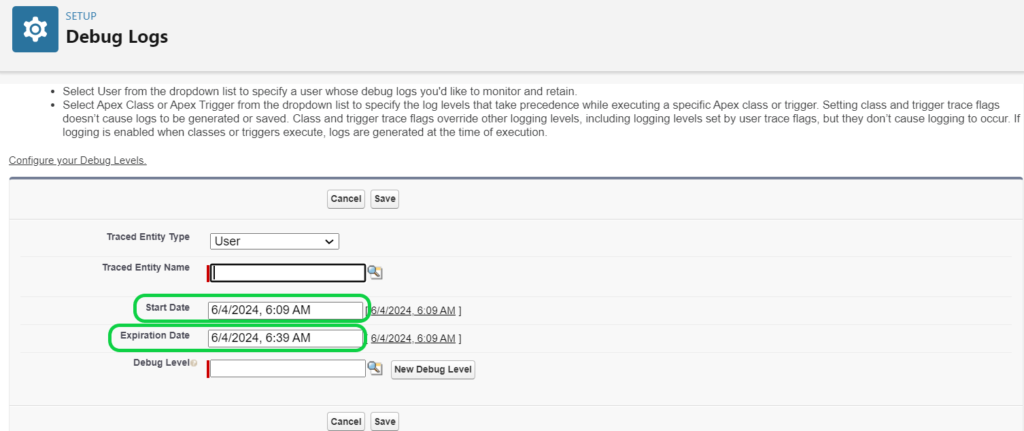
Accessing Debug Logs
Here’s how you can view your Salesforce debug logs:
- Navigate to the setup option within Salesforce.
- In the ‘Quick Find’ box, enter ‘Debug Logs’, then select ‘Debug Logs’ from the search results.
- Once you’ve selected Debug Logs, click the ‘View’ button to inspect the log.
- To download the logs as an XML file, click ‘Download’.
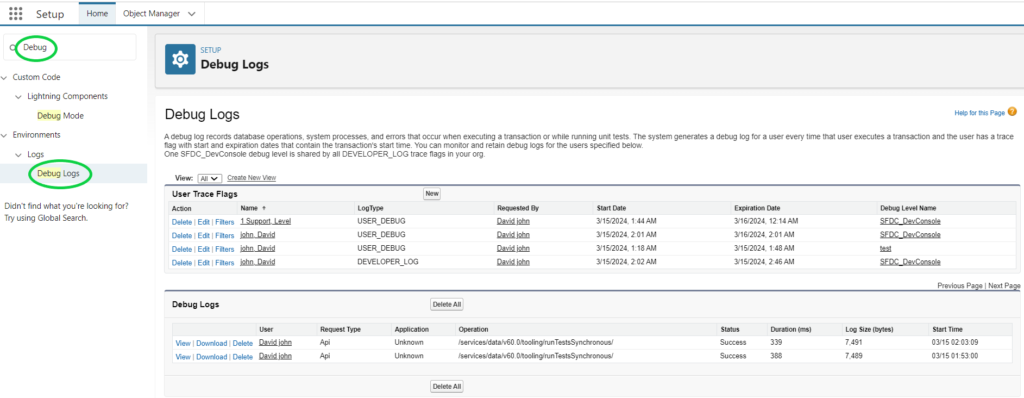
Categories in Salesforce Debug Logs

Salesforce Debug Logs encompass information related to various categories:
- Database: These logs provide insights into database activities, including data manipulation statements, SQL queries, and more.
- Workflow: Analysis of workflow pipelines is facilitated through Debug Logs, which store details about workflow rules, flows, processes, and similar elements.
- Rule Validation: This section may contain validation details of rules, including their names and whether they evaluated to true or false.
- Callout: Callout logs capture request-response exchanges in XML format from external web services. They aid in debugging API-related issues or troubleshooting user access to external objects.
- Apex Code: Information pertaining to Apex Code is included, covering aspects like DDL/DML statements, triggers, method initiation and completion, and more.
- Apex Profiling: These logs offer profiling details such as the number of queries executed, emails sent, and similar metrics.
- Visualforce: Details encompass formula evaluations, state serialization and deserialization, and other relevant information.
- System: This category logs all calls to system methods, including System.Debug methods.
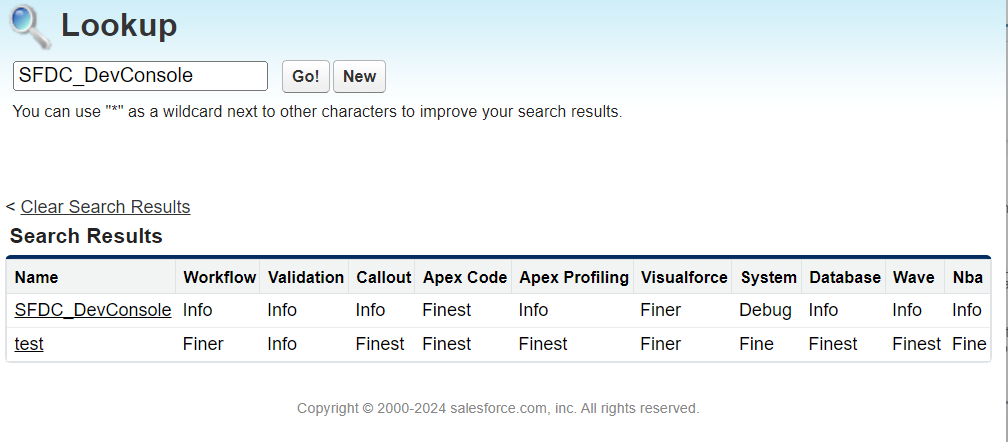
Debug Levels
Debug levels are crucial for determining the type of information logged during workflow execution. Utilizing different log levels aids in comprehending the process, job status, and internal details of code execution. Presented below are the log levels arranged from the lowest to the highest:

Error/Warn/Info: This level encompasses errors, warnings, and informational messages generated by the code. It assists in assessing job status, and in case of errors, the error log reveals corresponding error messages.
Debug: Debug level captures debug steps or statements typically generated by the System.debug method.
Fine, Finer: These levels may include DML statements, SQL queries, and details about user-defined method execution. Additionally, Fine/Finer levels provide insights into resources, SOQL/SQSL statements, and method invocations.
Finest: This level incorporates all logs generated by Fine or Finer levels, along with supplementary information about Apex Script.
The Log Levels are cumulative, meaning that selecting the highest level includes all information from lower levels. For instance, opting for the DEBUG level results in logs encompassing events logged at the INFO, WARN, and ERROR levels as well.
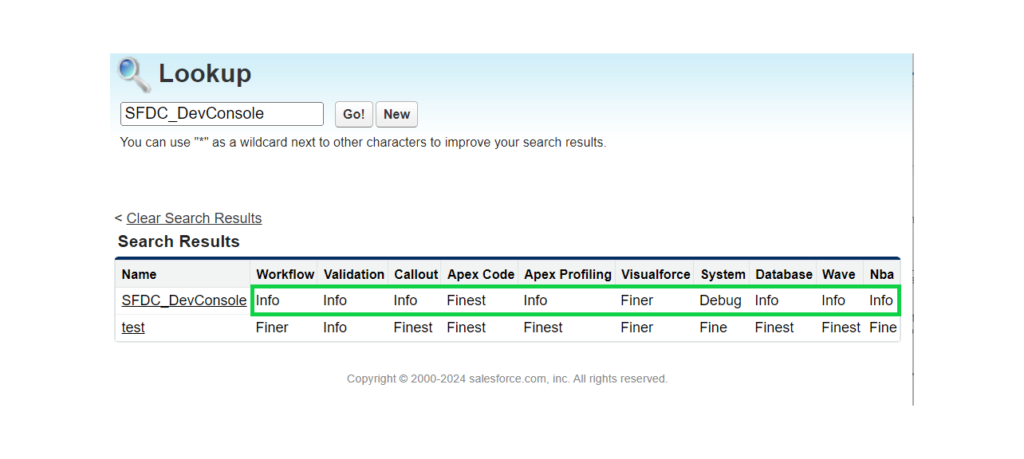
Creating Salesforce Debug Logs Video Tutorial
Further
➡️ Salesforce Advanced Admin Certification
➡️ Salesforce Platform Developer 1 Certification
➡️ Salesforce JavaScript Developer Certification
➡️ Salesforce Platform App Builder Certification
➡️ Salesforce Consultant Certification
Tag:Creating debug logs in Salesforce, Debugging in Salesforce, How to create debug logs in Salesforce, Salesforce debug log analysis, Salesforce debug log best practices, Salesforce debug log troubleshooting, Salesforce debug logs, Salesforce debug logs setup, Salesforce debug logs tutorial, Understanding Salesforce debug logs

