
How to Create Reports in Salesforce
If the report types mentioned earlier appear unclear, you’ll understand them better as I walk you through the process of how to create reports in Salesforce. As we delve into more intricate types, I’ll provide brief explanations for (almost) each one. (Joined reports are omitted as their complexity slightly exceeds the scope of this general report-building guide in Salesforce.)
1. Begin by navigating to the Reports tab and initiating a new report.
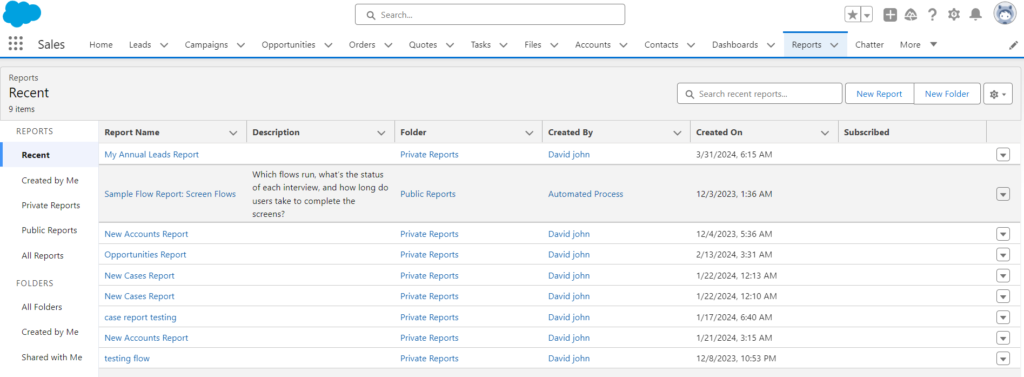
From any dashboard, you’ll find a Reports tab in the top navigation. On the main Reports page, there’s a New Report button.
Additionally, this page provides an overview of various preset report types within Salesforce. For illustrative purposes, I’ll begin creating a report from scratch. However, you also have the option to run one of the existing reports by selecting its name or exploring the dropdown menu on the right. The sidebar conveniently displays your history of previously used, created, or saved reports, which you can further organize into folders.
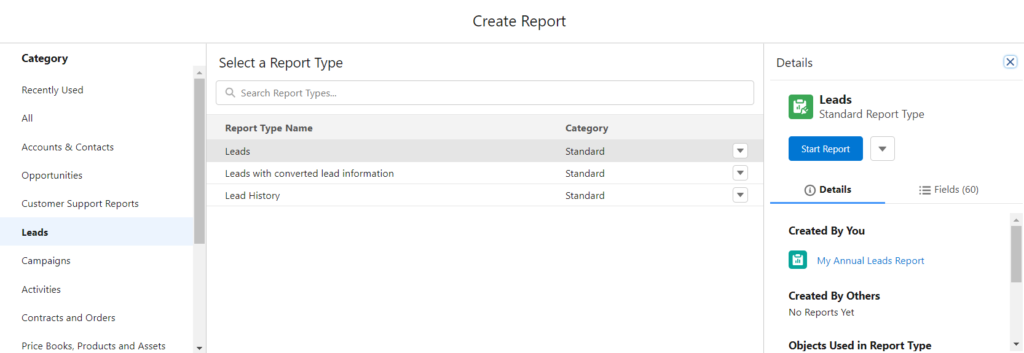
This action will open a window allowing you to choose from various fundamental report types. You have the option to customize which objects and fields to incorporate, although for the time being, I’ll maintain the default settings for this Leads report.
Press the “Start Report” button to initiate the report.
2. Modify your report settings as needed and then execute it.
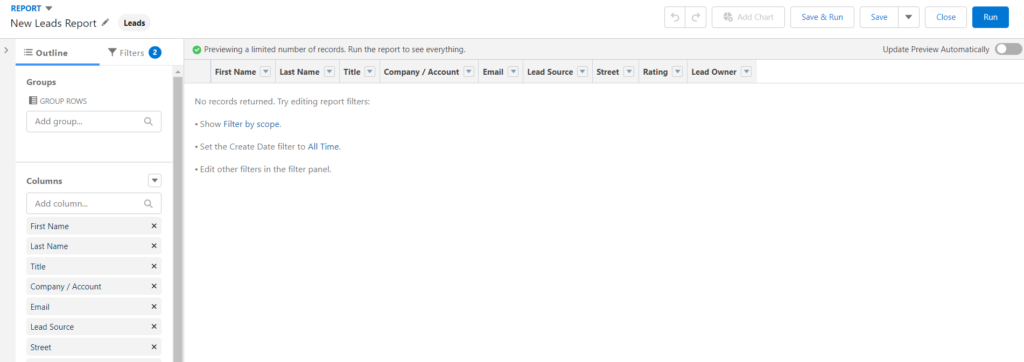
Once your new report loads, you’ll encounter an empty framework. On the left-hand side, within the Outline section, you have the option to add or remove fields which will serve as columns. Typically, for a Leads report, this encompasses details such as first name, title, and lead source. To streamline, I’ll exclude a few. (If you make edits here, a refresh may be necessary to reflect changes.)
Once your new report loads, you’ll encounter an empty framework. On the left-hand side, within the Outline section, you have the option to add or remove fields which will serve as columns. Typically, for a Leads report, this encompasses details such as first name, title, and lead source. To streamline, I’ll exclude a few. (If you make edits here, a refresh may be necessary to reflect changes.)
Adjacent to the Outline tab, you’ll notice a Filters tab. Here, you can adjust parameters concerning your data, such as lead creation date, leads organized by owner, and lead status. I’ll maintain these at their default settings.
Once you’ve configured the presets to your preference, utilize the options at the top to save the report for future use, execute the report, or both. Press “Run” when you’re prepared.
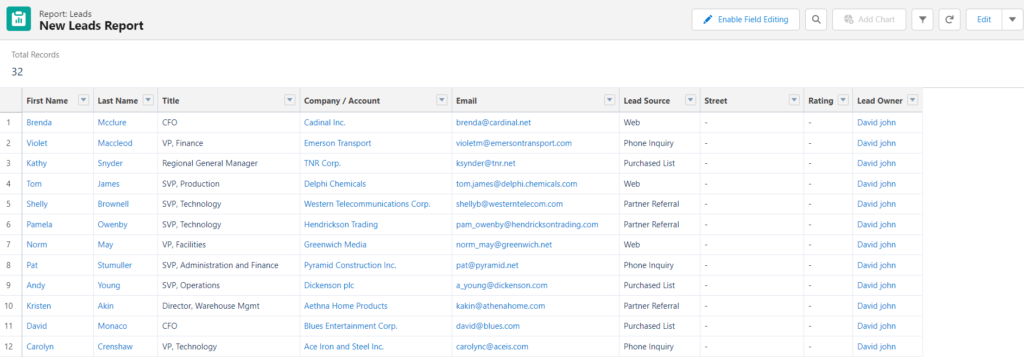
If your aim is to simply execute a straightforward tabular report, you’re finished. You can save it, export it, search within it, or arrange it. If you desire to introduce a touch more intricacy, proceed to step 3.
3. Create a summary report by grouping rows together.
Tap the Edit button to go back to the report editing interface. In the Groups section on the left navigation, within GROUP ROWS, I’ll input “Company / Account” to generate subgroups based on the account linked to each lead.
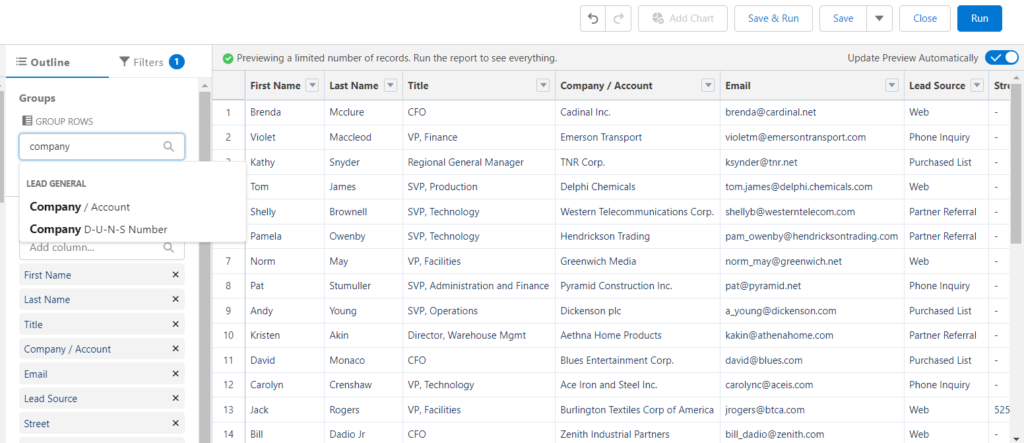
You also have the option to group by multiple fields, which doesn’t necessarily need to be part of your current report. This could include factors such as lead owner, rating, number of employees, location, and email bounce reason.
Once your groupings are configured, click on “Run.”
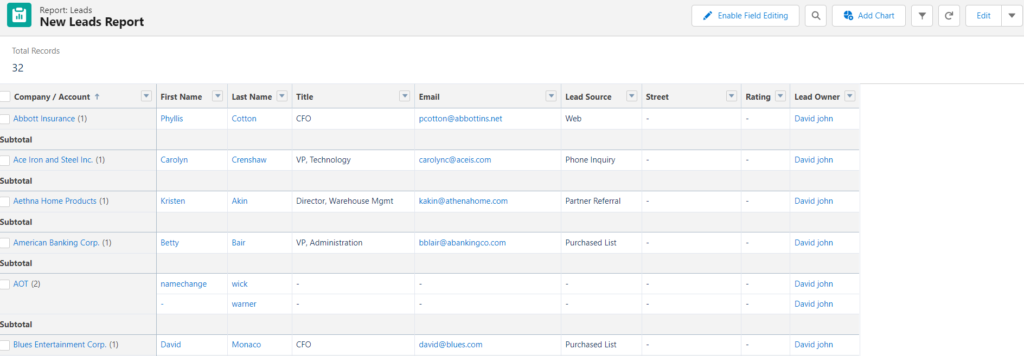
Here’s how my specific summary report appears. You have the option to further customize yours, continue sorting, include a chart, or introduce even more complexity in the subsequent step.
4. Create a matrix report by grouping columns together.
Let’s elevate this a bit by grouping both columns and rows. Click on the Edit button to return to the report editing page. Then, in the GROUP COLUMNS field below where you added rows for grouping, input additional grouping fields as desired. I’ll personally include “Lead Owner”. Press Run when you’re set.
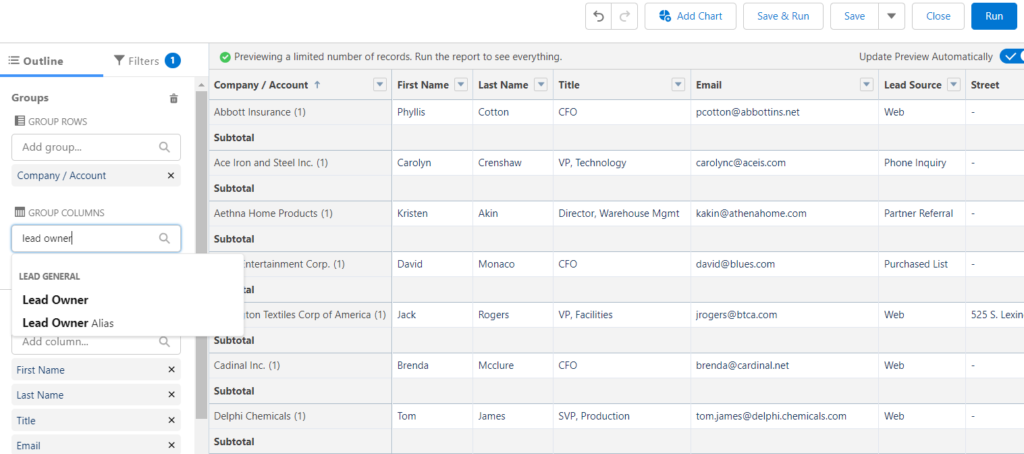
Your matrix report is now set to merge groupings across both horizontal and vertical axes. It will even display convenient totals across rows and columns. You can view these totals by scrolling right (if necessary) and down.

Scheduling Salesforce reports
If you wish to routinely execute standard reports, you also have the option to schedule them.
- Head back to the Reports page.
- Locate the desired report type.
- Select the dropdown arrow situated on the right side.
- Choose “Subscribe.”
- Configure your preferences for timing, delivery time, recipients, attachments, and conditions.
- Press “Save.”

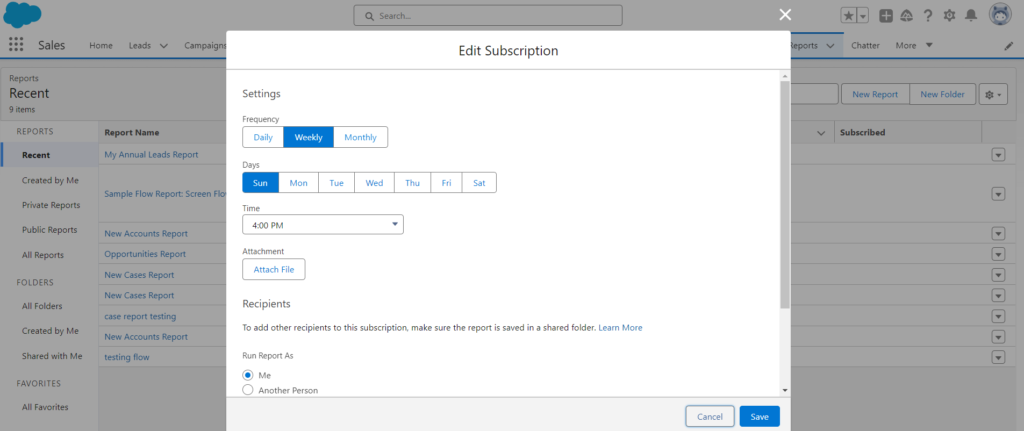
After configuring your subscription, those reports will be automatically sent to designated recipients at your preferred intervals.
Alternative choices for generating Salesforce reports.
For proficient users holding custom reporting privileges, there’s the option to craft personalized report types. I won’t delve into those specifics here, but here’s what you can anticipate from custom reports in Salesforce:
- Set the initial columns for your reports.
- Analyze up to four objects concurrently.
- Incorporate fields from associated objects into the report.
- Implement advanced section and field customization, sorting, and inclusions.
- Analyze relationships both “with” and “without.”
How to Create Reports in Salesforce Video Tutorial
Further
➡️ Salesforce Roles, Profiles, Permission Sets, and Permission Groups
➡️ Set up Case Team Roles in Salesforce


1 Comment