
How to Create Dashboards in Salesforce
As you progress in your Salesforce journey, gaining proficiency in dashboards and reports will naturally follow your comprehension of the Salesforce data model. Once you can generate Report Types and Reports that exhibit standard or custom object record data with filters, you’ll be prepared to advance to Salesforce dashboards. Let’s start How to Create Dashboards in Salesforce.
In this article, we’ll explore the definition of a Salesforce dashboard and the essential components needed, along with the procedure for creating your own dashboard from scratch in Lightning Experience.
What Do Dashboards Represent in Salesforce?
A Salesforce Dashboard offers a straightforward means to visualize vital data extracted from either a single Salesforce report or multiple reports. It aids in identifying trends, organizing quantities, and assessing the impact of various activities.
As a fundamental out-of-the-box feature of Salesforce, dashboards are compatible with both Salesforce Classic and Lightning Experience, as illustrated below.
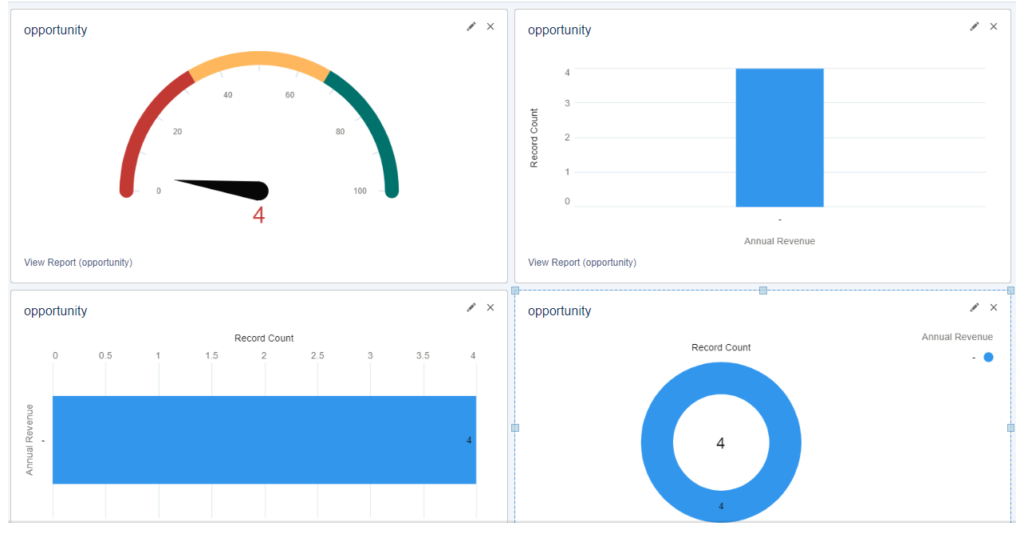
Components of Dashboards
Like the choices provided when incorporating a chart into a report, when adding a dashboard widget, you’ll be given the option to select from various available chart options. If the source report already includes a chart, you can also choose to retain the chart settings from there by selecting “Use chart settings from report.”
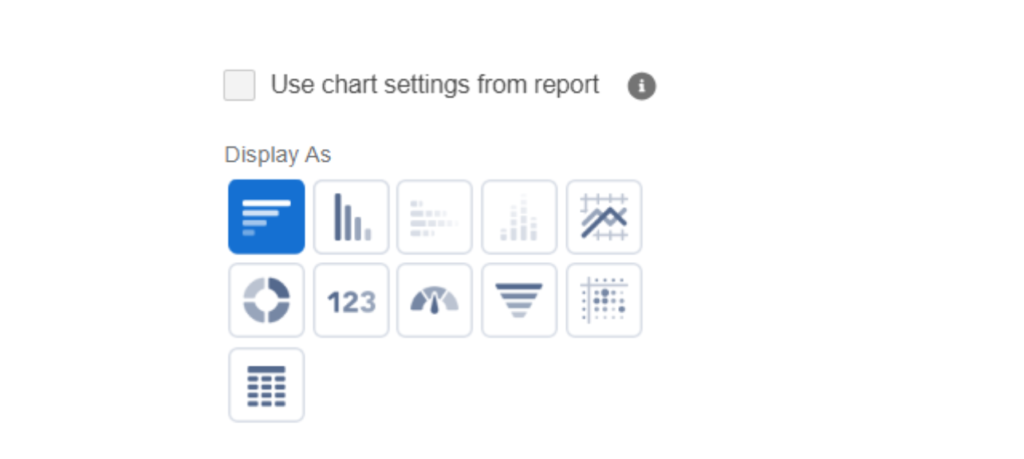
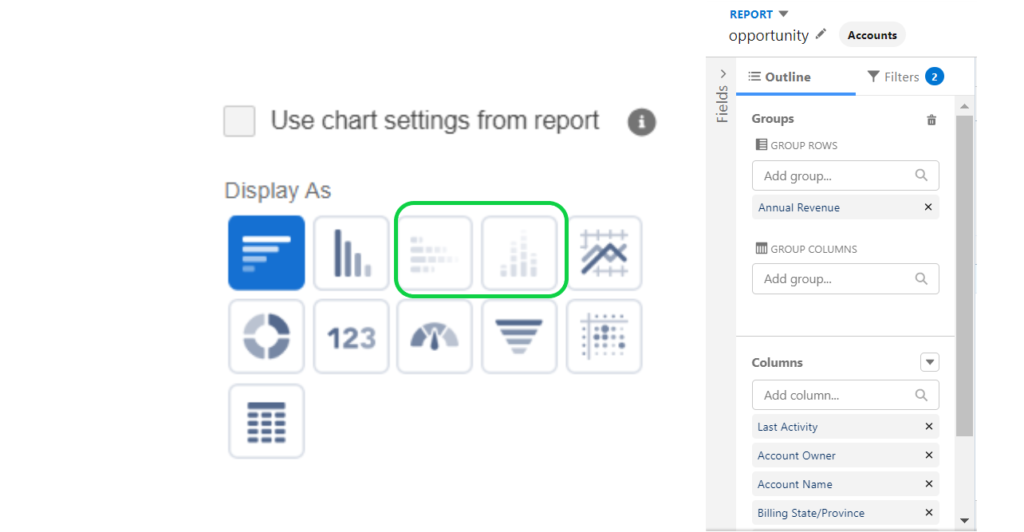
Note: Ensure that the source reports intended for your dashboard contain groupings – and sufficient groupings to accommodate the type of component you intend to utilize on the dashboard!
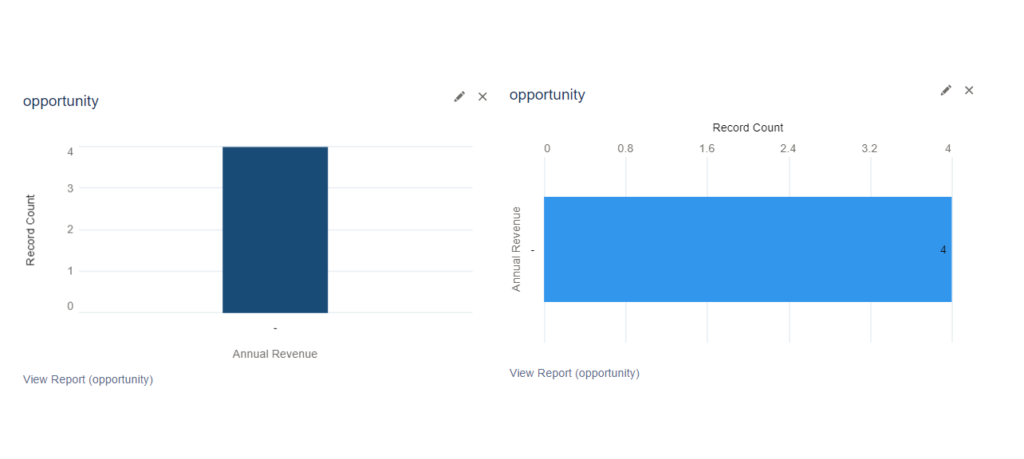
In the given example, the selected report had only one grouping, which is why the stacked bar charts were unavailable.
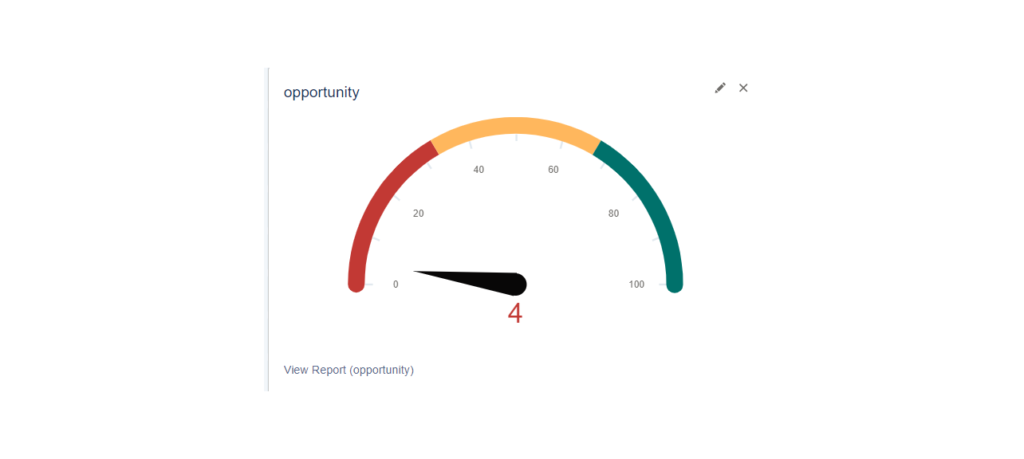
Selecting the appropriate chart is crucial for enhancing adoption, depending on the reports utilized and the data intended for display on your dashboard. For instance, gauge charts are optimal for monitoring progress towards sales monetary targets, while a donut chart can effectively illustrate open Leads by “status.”
Unsure about which chart component to utilize and when? Refer to Salesforce’s Lightning Design System for guidance.
Creating a Dashboard in Salesforce.
Now that we’ve discussed the fundamentals, let’s dive in! In our scenario, a sales manager wants to assess his team’s performance. He aims to view the total Opportunity amount linked with his team, individual contributions from each member, and a breakdown of Opportunities by “stage” for each sales representative.
Review Your Reports
Before commencing with the dashboard creation process, it’s crucial to verify that your reports are set up and accessible to the intended audience. In this scenario, all the necessary requirements could be fulfilled using a single Opportunity report. I’ve opted to store it in the public folder to ensure accessibility for all internal users.
Configure the Dashboard
As previously mentioned, this use case is straightforward, requiring all necessary data to be contained within a single report. Therefore, to present the essential information sought by the sales manager, we’ll utilize the same report for three distinct dashboard components.
Visualize the Data
Once all the desired components are added, the dashboard is prepared for sharing! Remember to provide training to the sales manager (and any other users utilizing the dashboards you’ve created), particularly regarding data refreshing, which can be accomplished by utilizing the “refresh” button located in the right-hand corner of the dashboard page.
Dynamic Dashboards
A noteworthy feature (though not utilized in constructing the sales manager’s overview dashboard) is the out-of-the-box dynamic dashboard functionality.
In essence, this feature permits selection of the running user of a dashboard – by default, this is the person creating the dashboard, but it can be altered at any time.
These options prove particularly useful when the sharing model for a specific object is set to private, yet users who wouldn’t typically have access to all the data need to view specific data on certain dashboard widgets. As mentioned earlier, here are the choices available to an admin when configuring a dashboard as ‘dynamic’:
- Another person: This can be any active Salesforce user with permissions to run reports and dashboards – viewers will see all data this user has access to. It’s important to note that this may expose data they wouldn’t normally have access to, so caution is advised when using this option!
- The dashboard viewer: This setting automatically changes the running user to the person viewing the dashboard – they will only see the data and fields they have at least “read access” to.
